This summer I attended DHSI at U Victoria, a trip made possible through the support of the Mellon Fellowship in DH here at UR. I had the great fortune to take James O’Sullivan’s course on Computation and Literary Criticism. (I also had the great fortune to eat at Red Fish Blue Fish, like, four times in five days.)
As one could guess, we learned a lot about distant reading and macroanlytic approaches to literary study, focusing on the technological pragmatics. So: we messed around in RStudio, creating stylometric cluster dendrograms; we dumped huge corpuses into Voyant Tools; we experimented with an open source Topic Modeling app (and talked about how mathematically insane topic modeling is).
The Blake Archive, of course, contains a trove of text that’s easily mineable from the backend. (Our tech editor Mike Fox emailed me plain text files of all Archive transcriptions for my experimenting.) Here are a couple of results from those experiments:
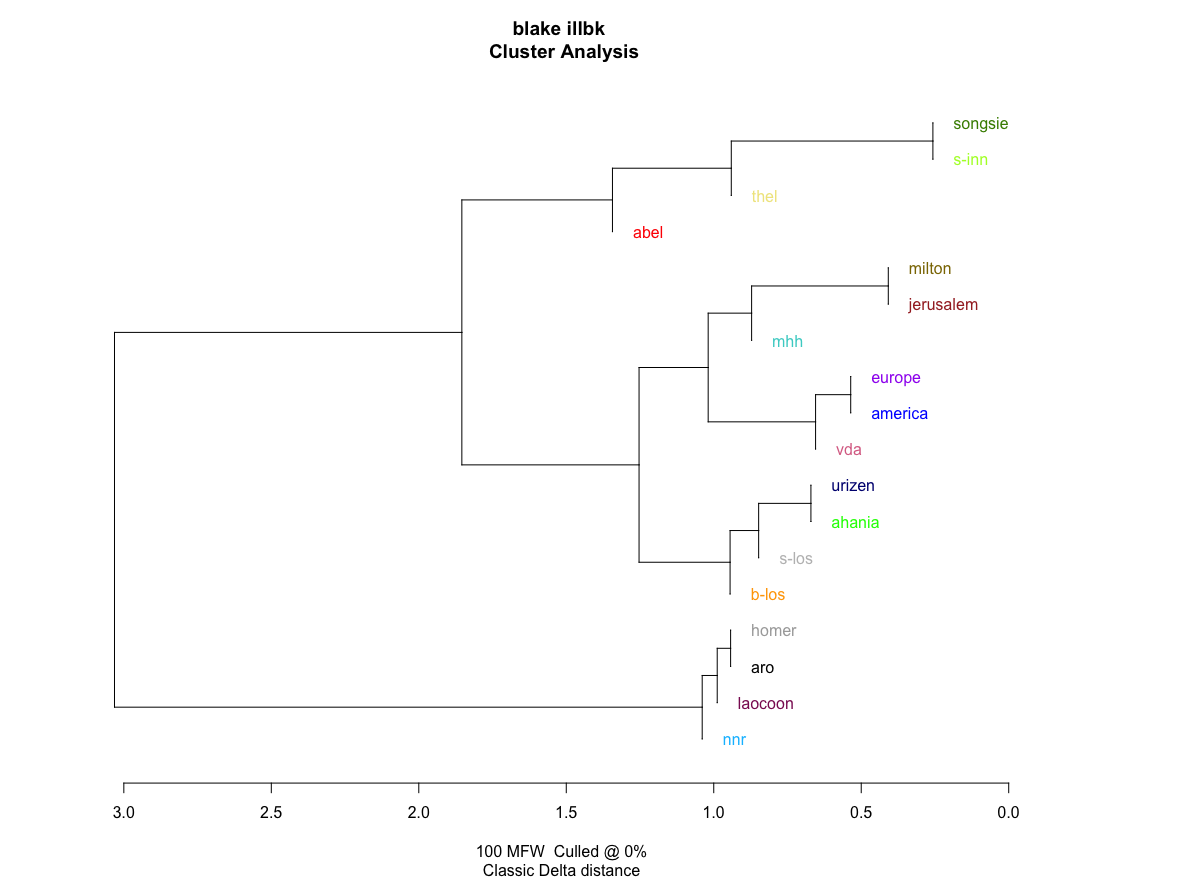
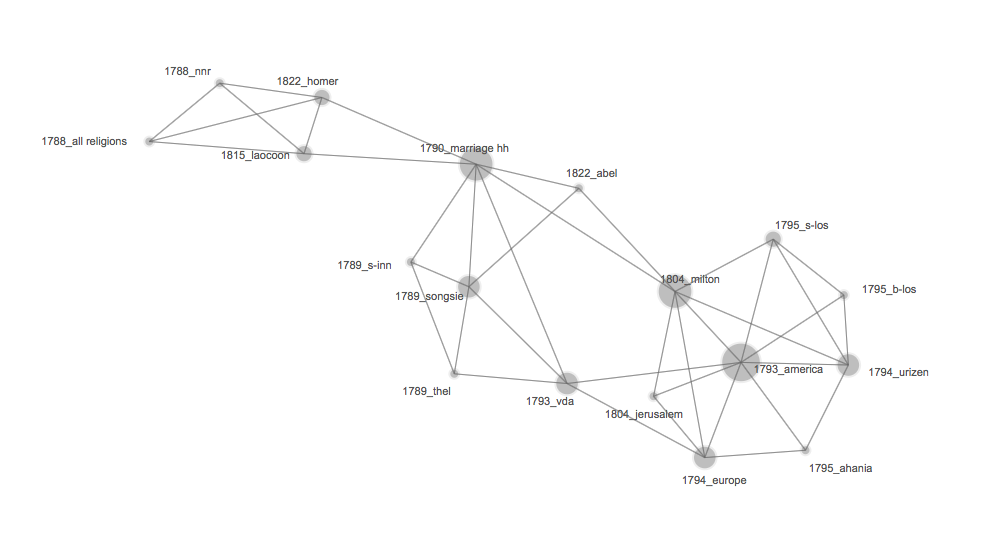
On the left, one of those stylometric cluster dendrograms. On the right, the same data dumped into a network visualization.
What exactly are these visualizing? Well, each is essentially a comparative statistical analysis of Blake’s illuminated books, using the 100 most frequent words in the corpus. (Most frequent words, as a statistical sampling model, are an alarmingly reliable stylistic identifier. Feel free to make an argument as to why.) The absolute values or placement in the visualizations are meaningless for our purposes; the point is how each dataset (ill. book) relates to all the others. Datasets clustered together are considered more stylistically similar by the sampling algorithm. In the network visualization, you can better see “bridge texts” or central texts that seem to connect certain styles to others.
OK, so what / who cares?
First, I don’t think Blake is a great candidate for most macro approaches, only because his textual output is relatively very small, and stats sampling works best when there is a lot of data. (For example, each Gates of Paradise doesn’t have enough text to even work with the stylometric program, so I had to remove them from the dataset.)
But even if the results aren’t particularly viable, the process is frequently an enlightening experience: defamiliarizing texts and relationships forces one to reconsider–or at least recognize–basic assumptions about an author or era.
At a meta-scholarship level, I also think the process demonstrates the value of digital editing as a creator of datasets. Most of the work in computation involves the preparation of datasets, and how one prepares a dataset has a profound impact on the results, no matter the analytic method. Editors are great at thinking about stuff like that. (Granted, all that pesky XML needs to be stripped from the transcription, but well-formed documents should allow that pretty easily.)
As a final thought, while I think Blake isn’t a great candidate for text-based computational approaches, Blake seems ideal for image-based computational research. For example, what happens when we plug the Archive’s entire collection of digital images into a program like ImagePlot? That idea, and a few others, have been kicked around the Rochester group this summer. I hope we have something to share in the future.
As an editorial project, our workflow tends to favor the ever-closer, ever-more-detailed account of Blake’s work. What happens when we step back and get a wider view?
Something about forests and trees…
—